


NanoTracers are a new class of fluorescent tracers obtained from the precipitation of organic dyes in water. Their unique physical and optical properties make them particularly well-suited for single-particle tracking experiments.
Sizes:
250µL Rheo Kit (IDY-NT-RK-250)Catalogue Numbers:
What makes them a top choice for single-particle tracking experiments?
-
Very low tendency to aggregate, thanks to their high intrinsic colloidal stability. This means they don't need any surface modification to prevent aggregation, a very practical feature when working with complex media.
- Small size (15 to 30 nm diameter), to achieve finer spatial scales and temporal resolution even in the most crowded environments.
- Excellent brightness and photostability, allowing for quick and reliable extraction of diffusion parameters.
- Versatile use: naturally biocompatible, these organic nanoparticles come in different versions tailored for specific media (non-biological, intra/extra-cellular or live tissues).
Two types of NanoTracers to fit your desired application:
NanoTracer - Rheo kit
Due to their spontaneous stealth behavior, these nanoparticles do not require the use of antifouling agents to impede interactions with cellular membranes.
They can be used to assess properties of any type of biological or non-biological media (i.e. extra-cellular space).
With a diameter averaging that of an antibody and record brightness in 2-photon microscopy, they are perfectly compatible with deep tissue imaging for exploring the extra-cellular space of living tissues.
Key features:
- No interactions with living cells
- Red emission
- Compatible with 2-photon microscopy
- Median diameter: 15 nm
NanoTracer - Cell kit
These nanoparticles are naturally taken up by live cells with no signs of toxicity or unspecific binding to cellular membranes.
They can be used for intracellular single-particle experiments to assess internal cell media properties or track intracellular transport dynamics.
With an ultra-high near-IR brightness and large Stokes' shift, they can be tracked at low laser intensities to best preserve cell physiology.
Key features:
- Natural intracellular uptake
- Bright near-IR emission with minimal laser intensity
- No cytotoxicity
- Compatible with 2-photon microscopy
- Median diameter: 20 nm
Additional documents:
NanoTracer - Rheo kit |
NanoTracer - Cell kit |
|
|
Protocol:
Optimal dilution varies depending on the targeted application. Stock solutions should be diluted between 1:100 and 1:10000 for extracellular single-particle tracking experiments, or between 1:10 and 1:100 for intracellular single-particle tracking experiments.
Results
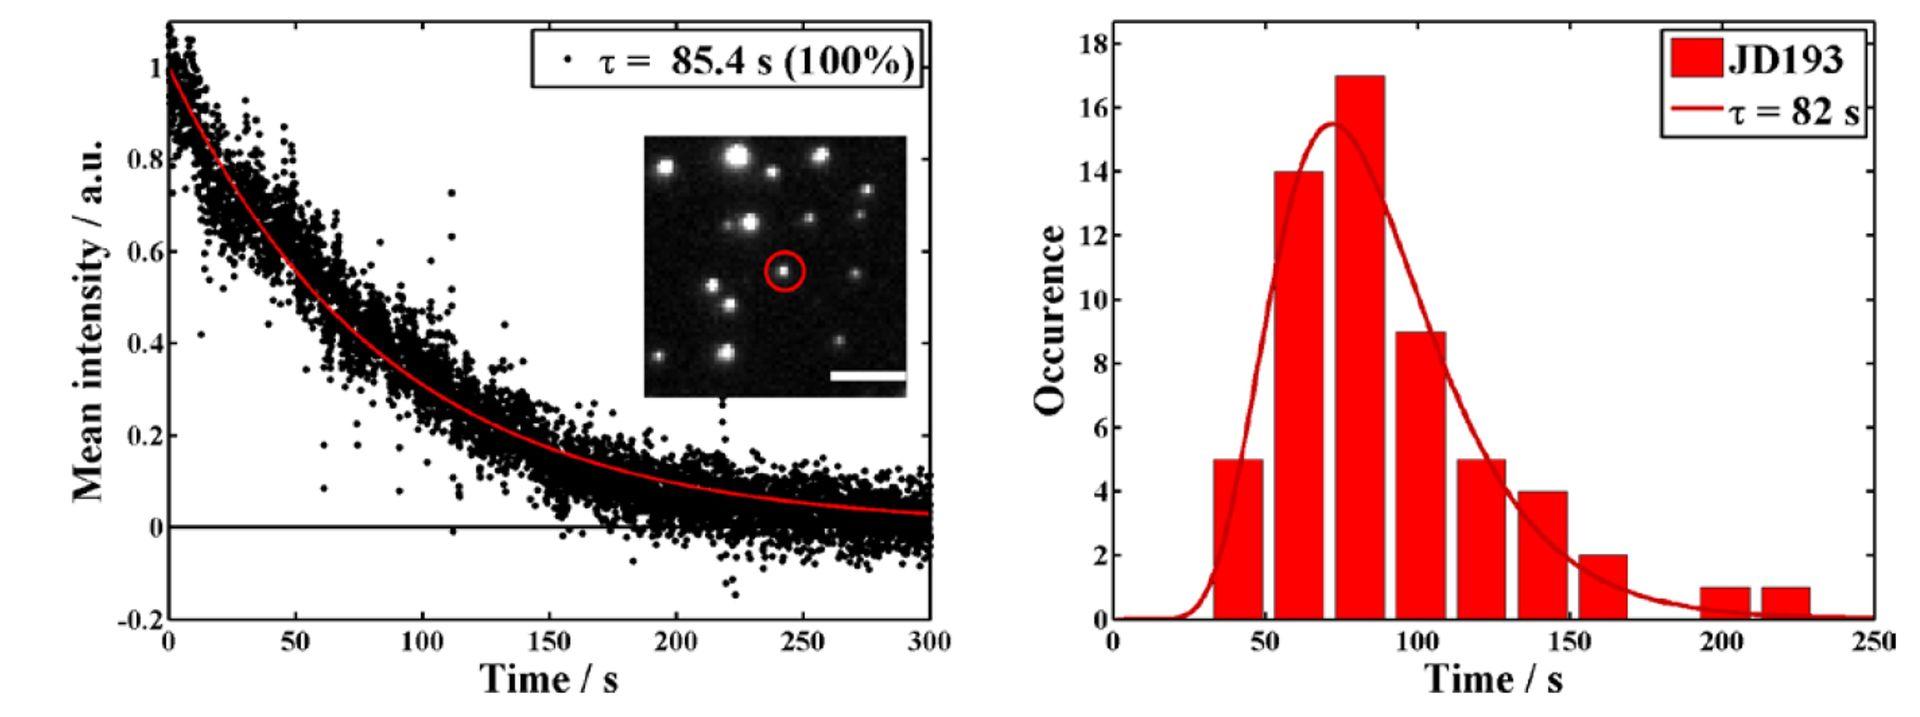
Single-molecule photostability study of NanoTracers shows longtime single-particle tracking capacity
Single particle tracking of NanoTracers - Cell kit in live cells
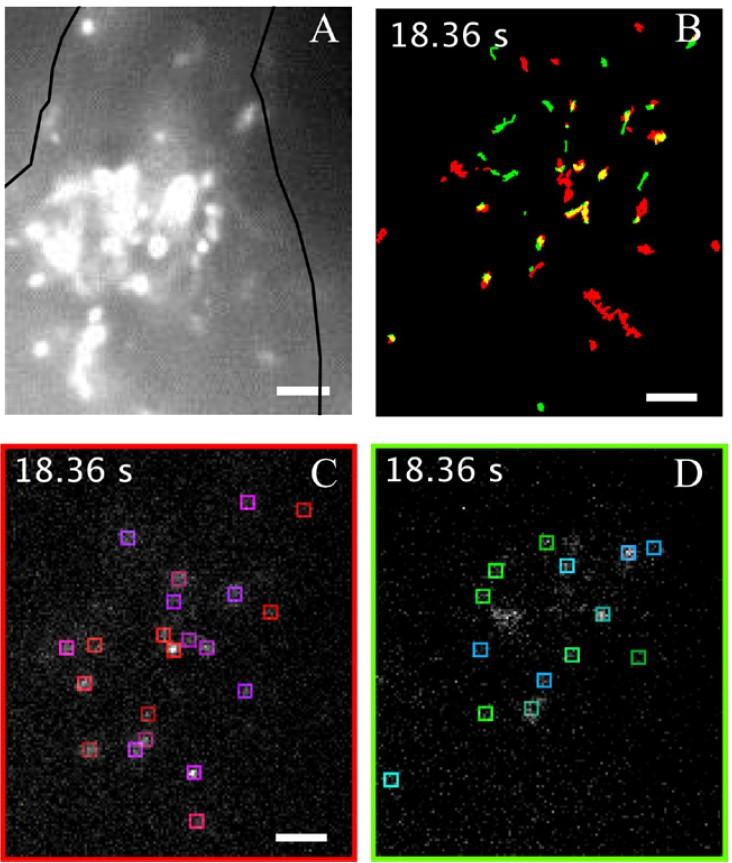 COS7 cells were incubated with green and near-IR NanoTracer – Cell kit for 2 h, washed and imaged live under 488 nm inclined illumination. (A) Intensity average of a sub-region of a representative acquisition. The contour of the cell is drawn in black. For each channel, emitting nanoparticles are detected, fitted with a 2D-Gaussian (colored boxes in (C) and (D), NIR and green channels, resp.) and tracked between consecutive frames ((B), red and green traces for the NIR and green channels, resp.). To superpose the tracks from both channels, a simple linear transformation is applied. Analysis for one representative frame is shown (B)–(D), see movies S4 andS5 (stacks.iop.org/JPhysD/49/084002/mmedia) for the complete analysis). Scale bars: 5 μm. 488 nm laser power of 306 W·cm−2 was used for these experiments..
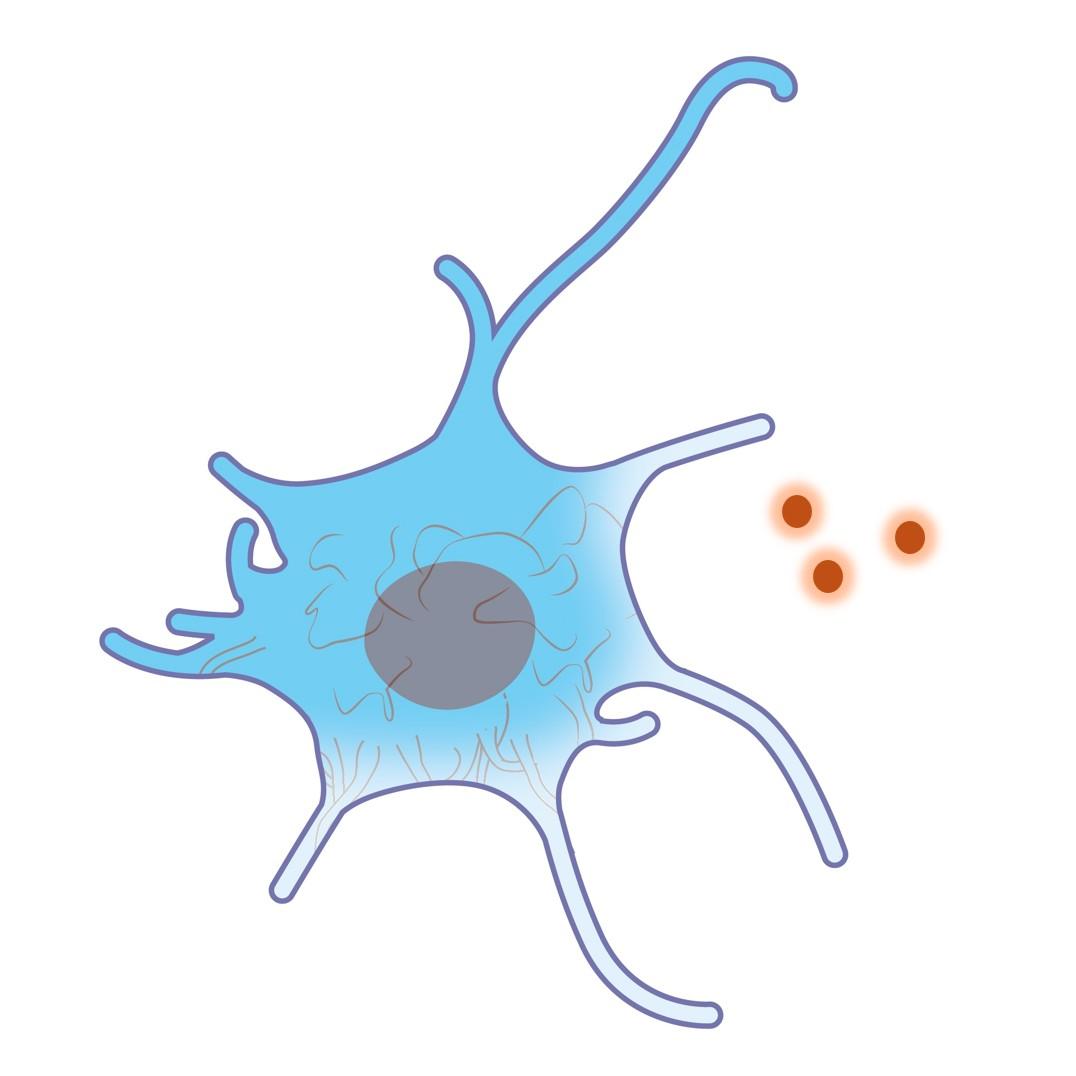
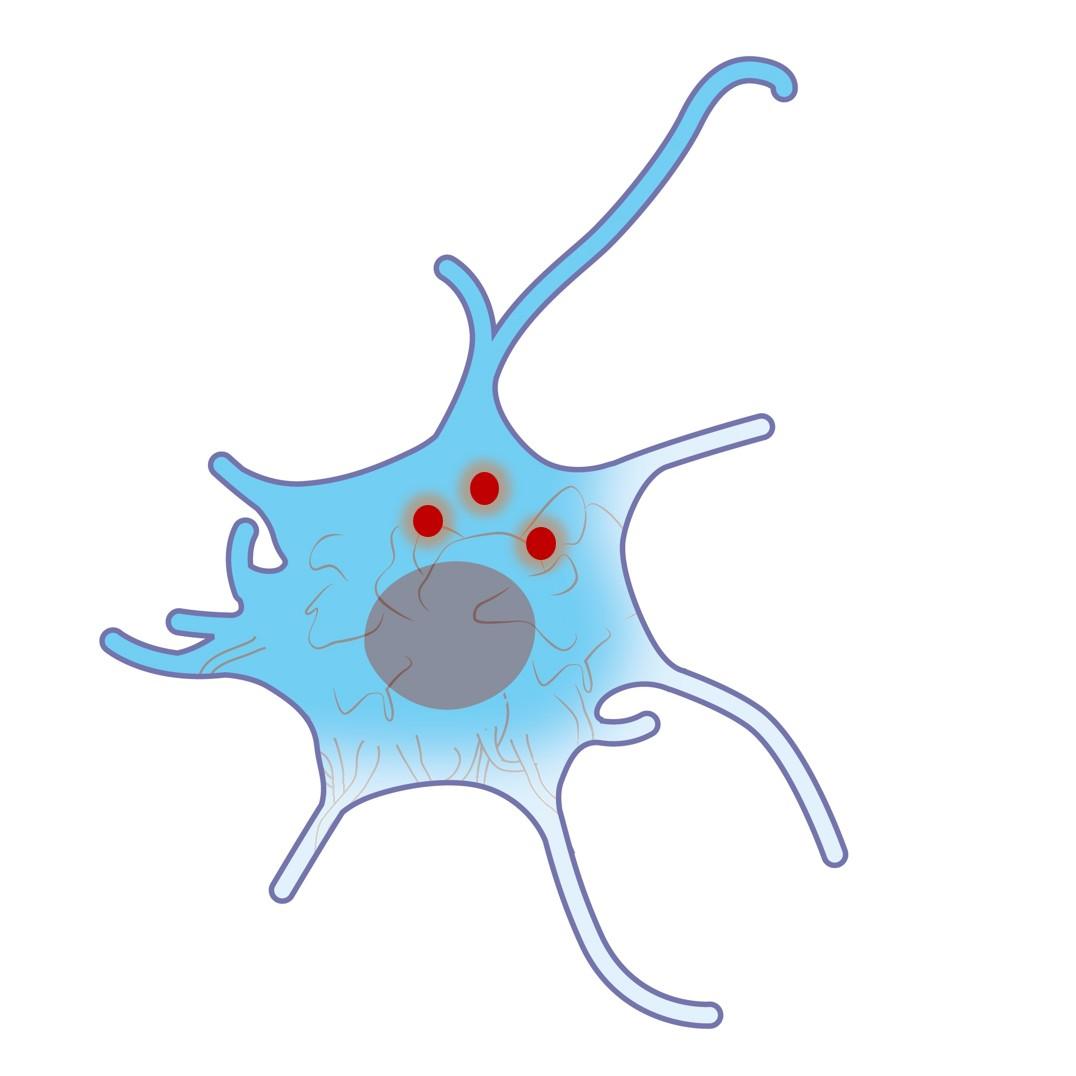
Interplay between NanoTracers - Rheo kit and live cells
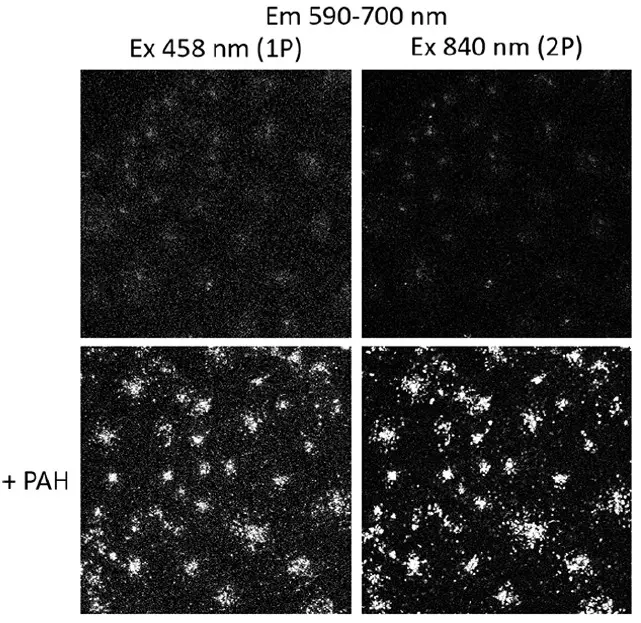
Source publication: Pagano P. et al, 2021
Single-particle tracking of NanoTracers in water
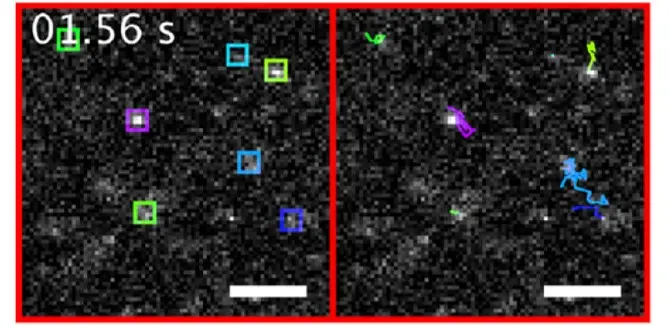 NanoTracers – Cell kit were imaged freely diffusing in water. The cumulative trajectories of the nanoparticles detected in each frame (left, in colored boxes) are shown on the right sub-panel using a corresponding color code. For each single nanoparticle tracked for more than four frames, its diffusion coefficient was extracted from its square displacements. Scale bars: 5 μm. A 488 nm laser power of 306 W·cm−2 was used for these experiments.