


Induce well-controlled topological cues on live cells or planar model membranes
Sizes:
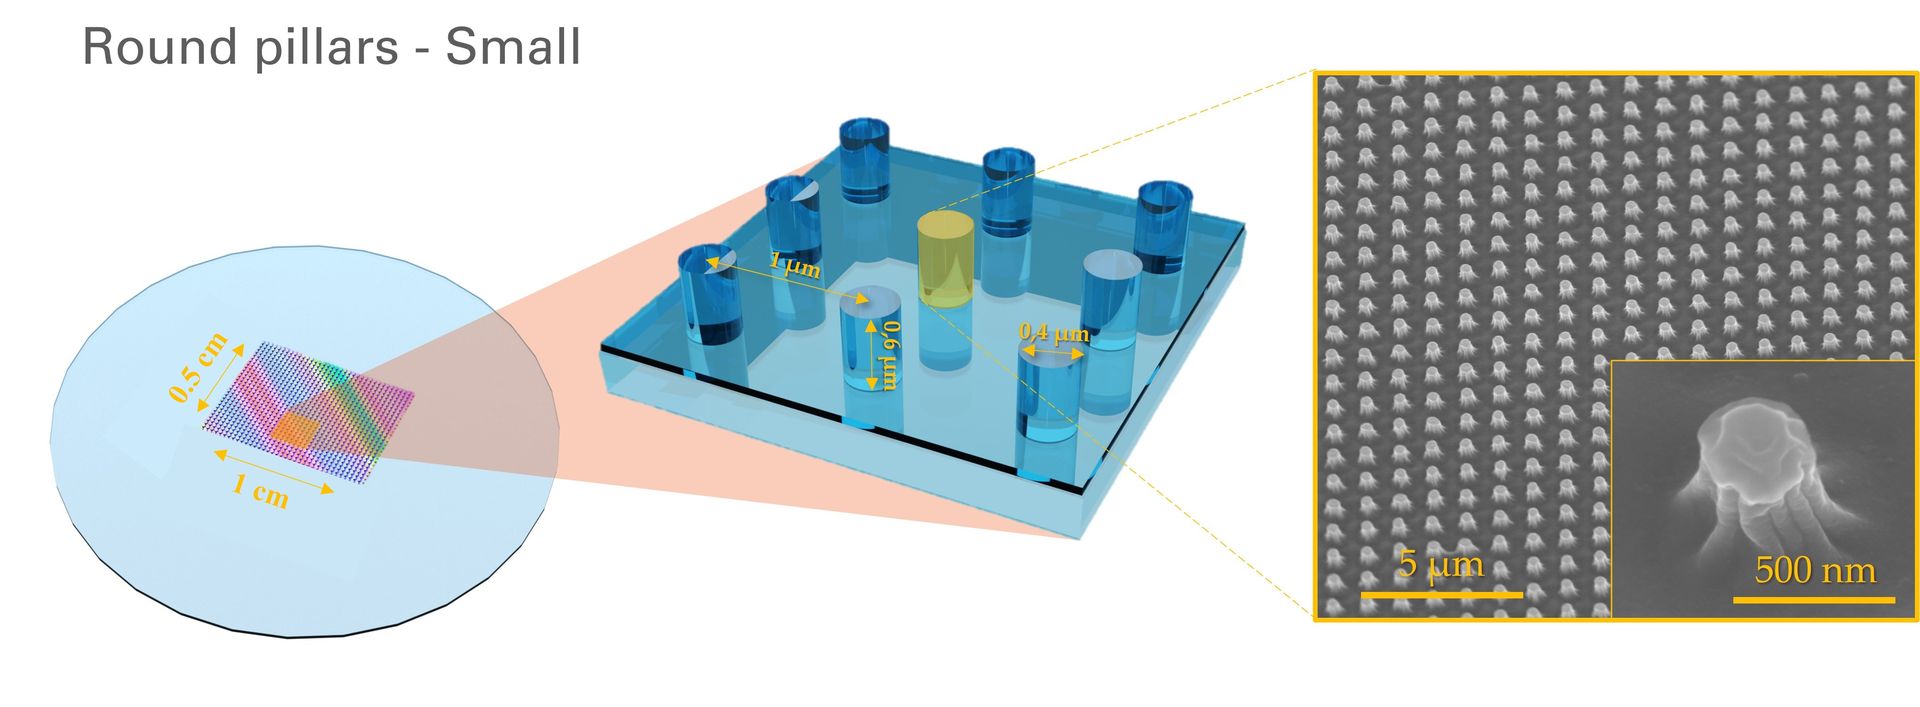
FakirSlide coverslip - Round pillars - Small (IDY-FAK-RP-S1)
FakirSlide coverslip - Round pillars - Small (IDY-FAK-RP-S20)
FakirSlide coverslip - Round pillars - Small (IDY-FAK-RP-S50)
FakirSlide coverslip - Round pillars - Large (IDY-FAK-RP-L1)
FakirSlide coverslip - Round pillars - Large (IDY-FAK-RP-L20)
FakirSlide coverslip - Round pillars - Large (IDY-FAK-RP-L50)
FakirSlide coverslip - Square pillars (IDY-FAK-SP-1)
FakirSlide coverslip - Square pillars (IDY-FAK-SP-20)
FakirSlide coverslip - Square pillars (IDY-FAK-SP-50)
FakirSlide coverslip - Nano-domes - Small (IDY-FAK-ND-S1)
FakirSlide coverslip - Nano-domes - Small (IDY-FAK-ND-S20)
FakirSlide coverslip - Nano-domes - Small (IDY-FAK-ND-S50)
FakirSlide coverslip - Nano-domes - Large (IDY-FAK-ND-L1)
FakirSlide coverslip - Nano-domes - Large (IDY-FAK-ND-L20)
FakirSlide coverslip - Nano-domes - Large (IDY-FAK-ND-L50)
FakirSlide coverslip - Nano-cones (IDY-FAK-NC-1)
FakirSlide coverslip - Nano-cones (IDY-FAK-NC-20)
FakirSlide coverslip - Nano-cones (IDY-FAK-NC-50)
Catalogue Numbers:
IDY-FAK-RP-S1 (FakirSlide coverslip - Round pillars - Small)
IDY-FAK-RP-S20 (FakirSlide coverslip - Round pillars - Small)
IDY-FAK-RP-S50 (FakirSlide coverslip - Round pillars - Small)
IDY-FAK-RP-L1 (FakirSlide coverslip - Round pillars - Large)
IDY-FAK-RP-L20 (FakirSlide coverslip - Round pillars - Large)
IDY-FAK-RP-L50 (FakirSlide coverslip - Round pillars - Large)
IDY-FAK-SP-1 (FakirSlide coverslip - Square pillars)
IDY-FAK-SP-20 (FakirSlide coverslip - Square pillars)
IDY-FAK-SP-50 (FakirSlide coverslip - Square pillars)
IDY-FAK-ND-S1 (FakirSlide coverslip - Nano-domes - Small)
IDY-FAK-ND-S20 (FakirSlide coverslip - Nano-domes - Small)
IDY-FAK-ND-S50 (FakirSlide coverslip - Nano-domes - Small)
IDY-FAK-ND-L1 (FakirSlide coverslip - Nano-domes - Large)
IDY-FAK-ND-L20 (FakirSlide coverslip - Nano-domes - Large)
IDY-FAK-ND-L50 (FakirSlide coverslip - Nano-domes - Large)
IDY-FAK-NC-1 (FakirSlide coverslip - Nano-cones)
IDY-FAK-NC-20 (FakirSlide coverslip - Nano-cones)
IDY-FAK-NC-50 (FakirSlide coverslip - Nano-cones)
FakirSlide are ready-to-use coverslips patterned with micro- and nano-structures to induce diverse, well-controlled topological cues on live cells or membrane mimetic systems.
Made of borosilicate glass, they are compatible with all types of advanced microscopies and provide a solid support allowing for long-term experiments.
Unlock new insights! Based on a newly-developed nanostructuration technique called soft nanoimprint lithography, FakirSlide pushes the resolution boundaries and makes available to researchers a diverse panel of reproducible micro to nano-scale topographies of various aspect ratios to better investigate key cellular responses to specific membrane topologies. Check out our available catalog below.
Maximize your assay reliability - FakirSlide provides ordered arrays of structures with high control over their shape, diameter and periodicity. They were specifically designed to induce robust & consistent membrane curvatures and facilitate data analysis.
Simplify your experimental workflows: made of a high-quality synthetic silica layer, the Fakirslide surface is directly functional for supported lipid bilayers without the need for harsh cleaning or hydroxylating pre-treatments.
Fakirslides substrates have been successfully used to manipulate membrane morphology of living cells and supported lipid bilayers, and observe effects of curvatures on membrane protein dynamics, cytoskeletal reorganization and cell migration. Check out relevant publications and example results in our dedicated sections.
The shape catalog of FakirSlide

We are thrilled to introduce our newly-released design, the Nanocones, that just joined the FakirSlide catalog:
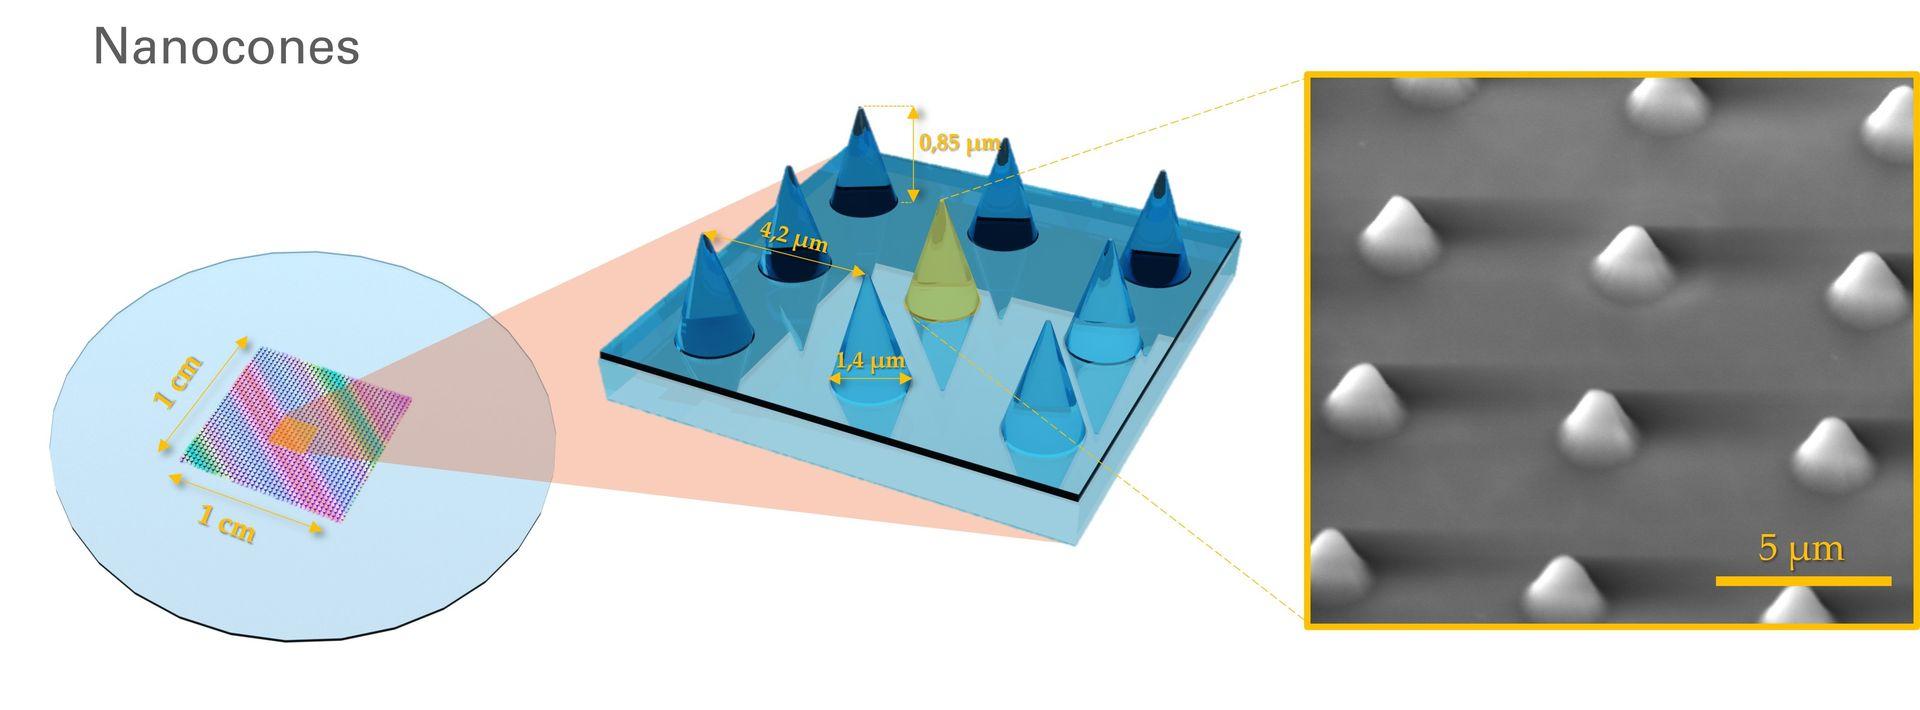
The FakirSlide technology paves the way to a new kind of nanostructures for biological applications, allowing for high flexibility in designs. It is thanks to your interest and feedback that we will be able to expand this catalog and offer new shapes in the future.
Applications
Use FakirSlide to apply membrane deformations on cultured cells or membrane-mimetic systems. Experimental outputs include:
- Live cell imaging
- Immunostaining
- Migration assays
Compatible imaging modes: confocal microscopy, Airyscan microscopy, TIRF, super-resolution microscopy (2D and 3D STED, PALM/STORM), Scanning Electron Microscopy (SEM), Atomic Force Microscopy (AFM).
Cell types: So far, FakirSlide has been successfully used with a variety of human (HeLa, U-2 OS, HT1080, SUM159, RPE-1, THP-1 & human monocyte-derived dendritic cells (moDC)) and murine (C2C12 mouse myoblasts) cells.
Supported membranes: So far, FakirSlide has been successfully used with a variety of neutral (DOPC, Egg-PC, POPC, POPE & Egg-PE) and negatively-charged (Liver-PI, Brain-PS, Brain-PI(4,5)P2 & Brain-PI4P) lipid mixtures.
Specifications
Surface topographies: round or square pillars, nanodomes or nanocones
Approx. pattern area: 1 cm x 1 cm
Surface material: borosilicate glass
Coverslip diameter: 25 mm
Coverslip thickness N°: 1.5H (0.170 mm ± 0.005 mm)
Cell culture treated: No
Storage: can be stored indefinitely at room temperature when protected from dust & humidity
Additional Resources:
Results
Live imaging of plasma membrane and actin dynamics of cells seeded on FakirSlide round pillars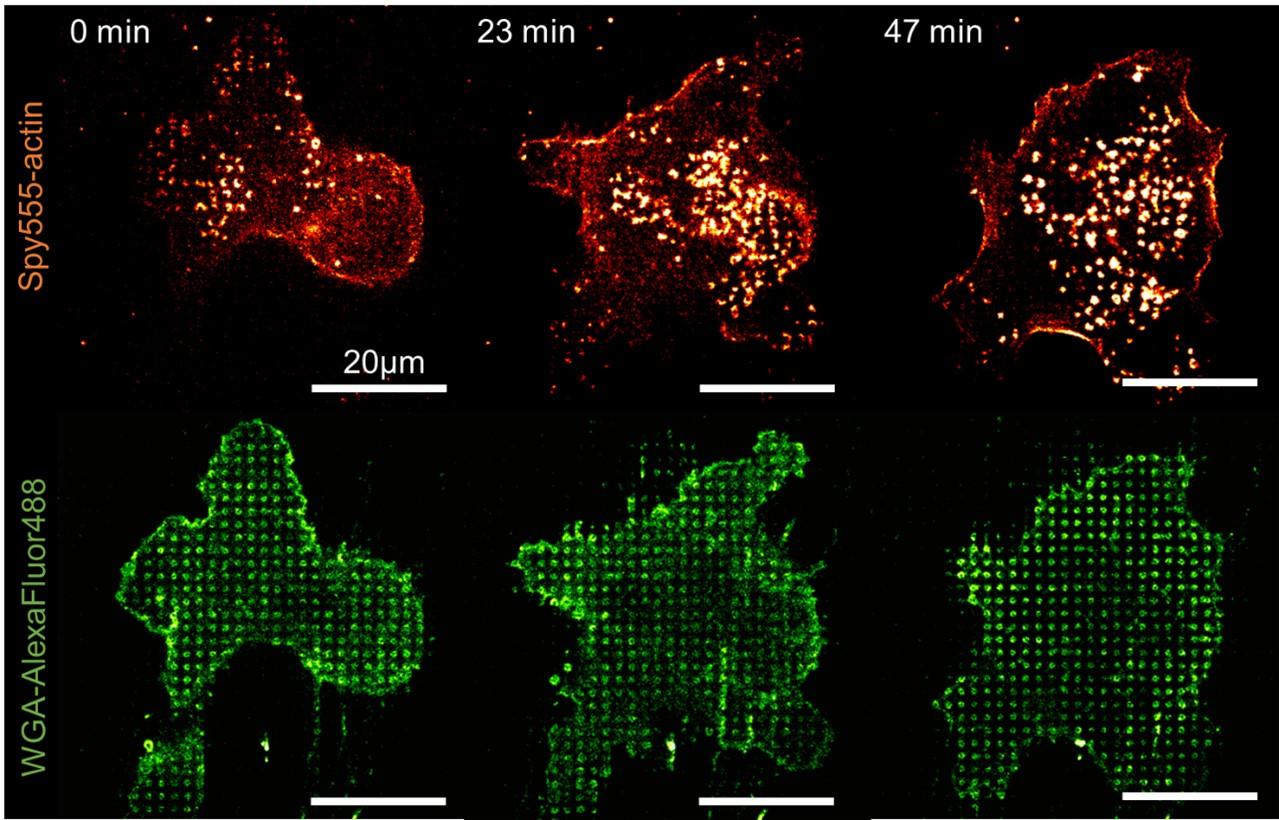
Image credits: Raissa Rathar - IRIM Montpellier, 2022
Super-resolution imaging of actin reorganization in cells seeded on FakirSlide round pillars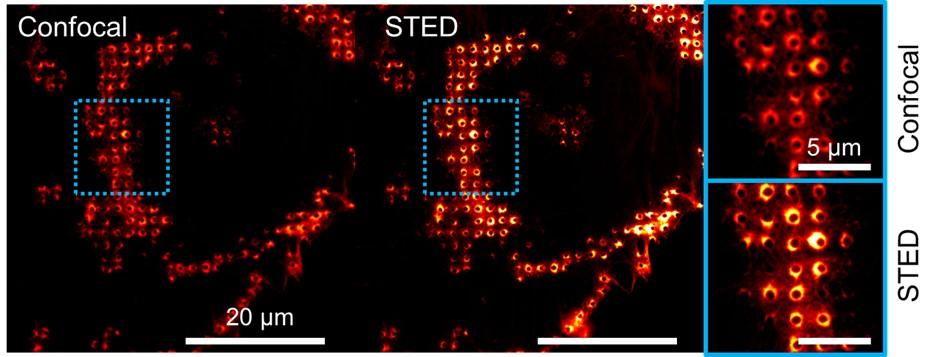
Image credits: Raissa Rathar - IRIM Montpellier, 2022
Organization of purified recombinant proteins on FakirSlide nano-domes coated with isolated membranes 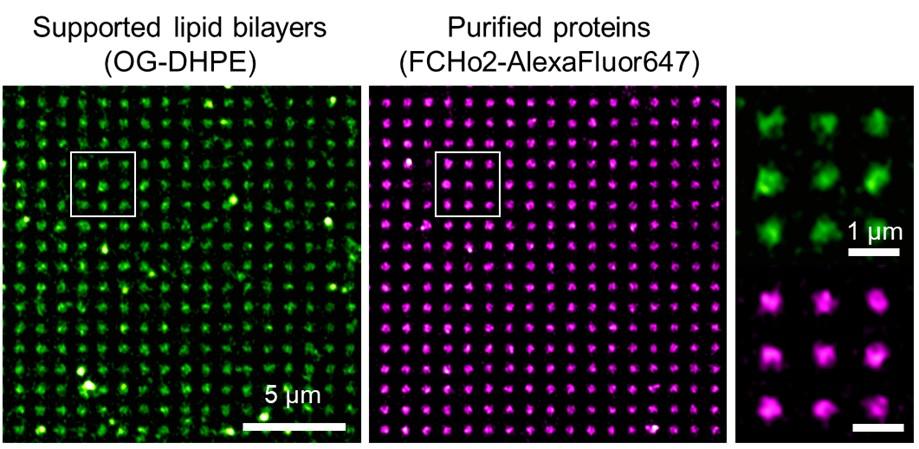
Image credits: El Alaoui et al., 2022
Organization of proteins by immunolabeling of cells seeded on FakirSlide round pillars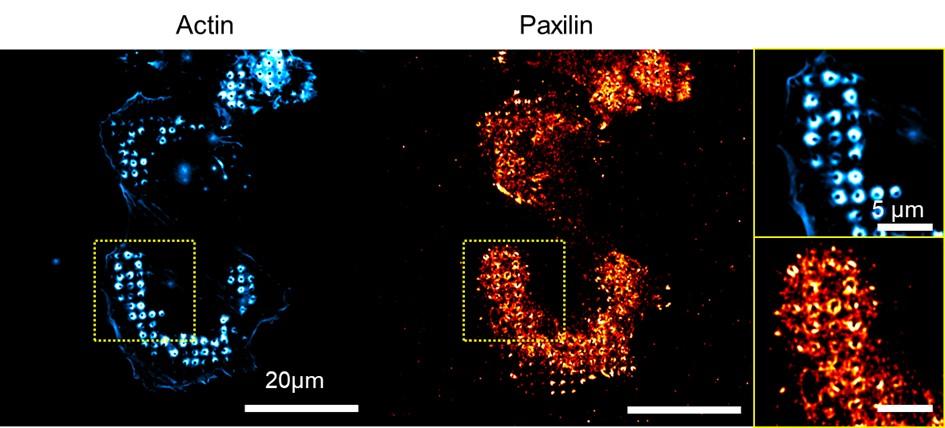
Image credits: Raissa Rathar - IRIM Montpellier, 2021
Cell migration assay on FakirSlide round pillars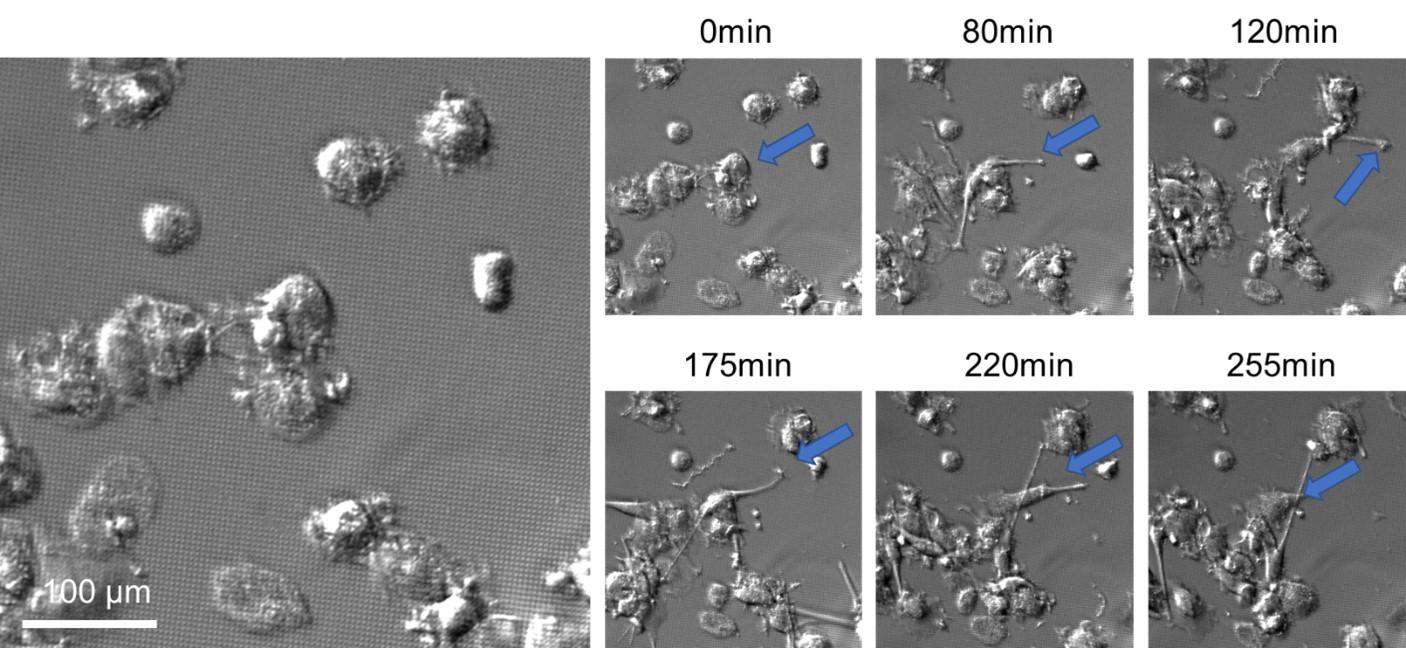
Image credits: Raissa Rathar - IRIM Montpellier, 2021
Association of wild-type septins and septin mutants with lipid membranes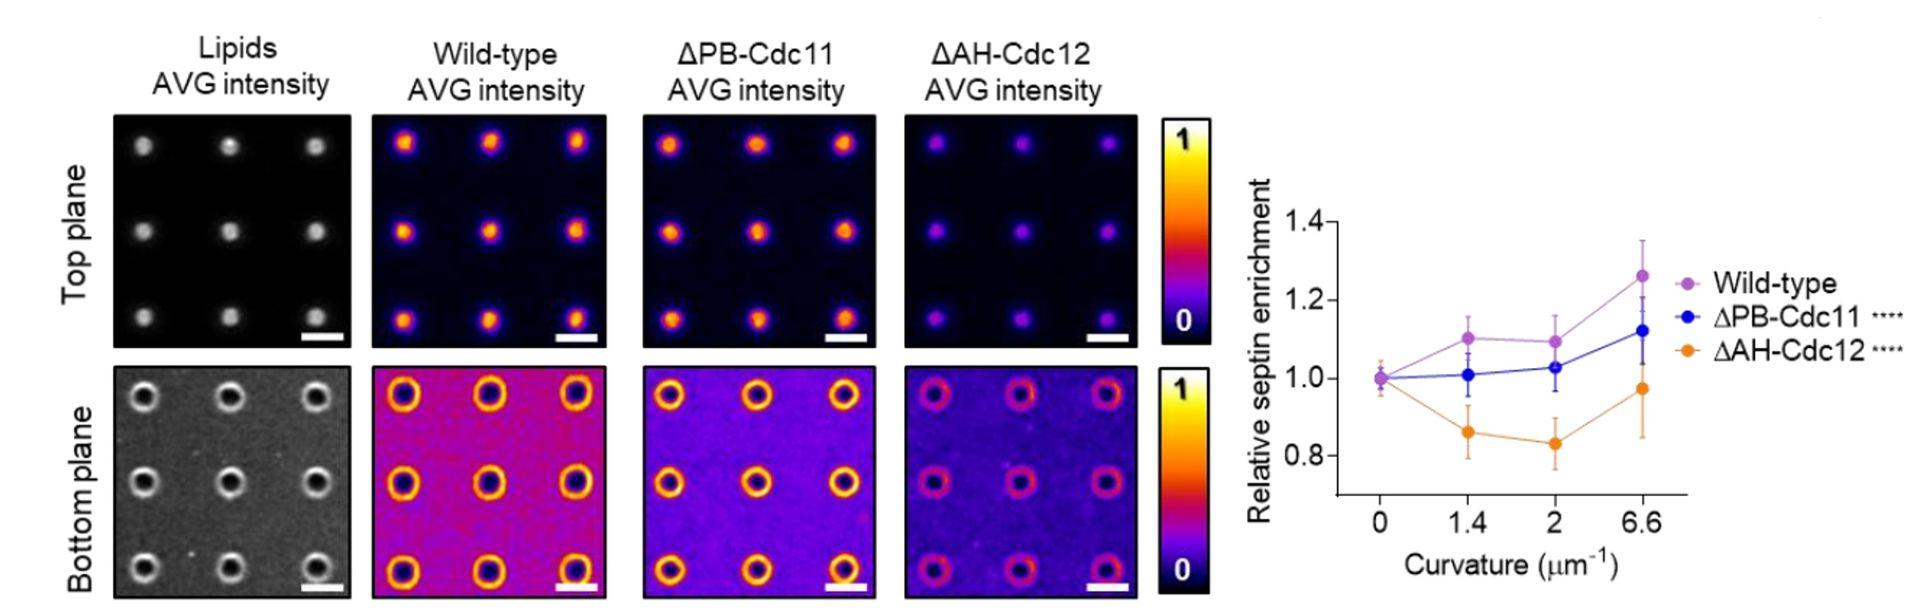
Source publication: El Alaoui et al, Septin filament assembly assist the lateral organization of membranes, bioRxiv 2024; https://doi.org/10.1101/2024.03.19.585775
Effects of surface topography on the spatial organization of immune receptors in hDCs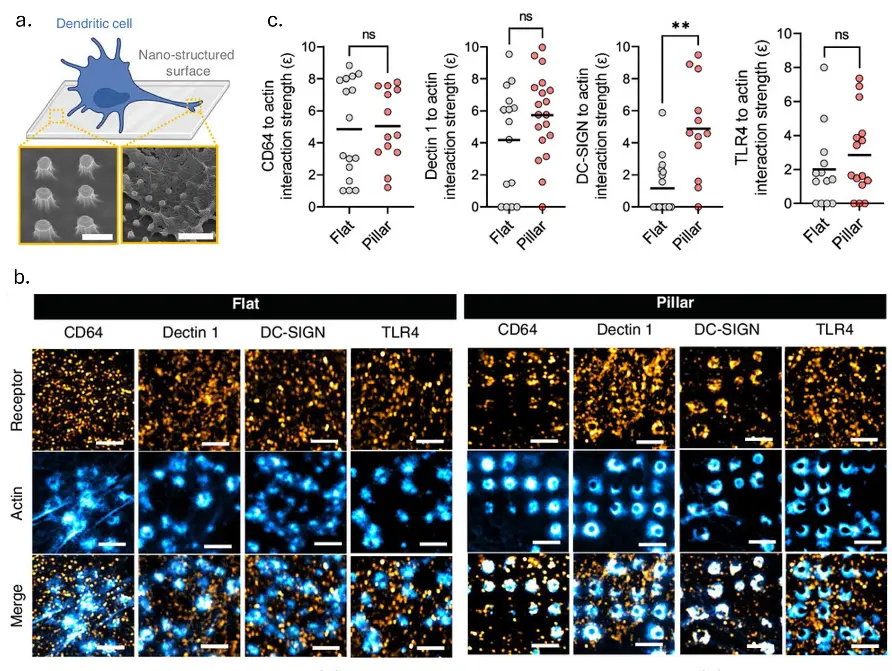
Source publication: Rathar R. et al, (2024). Tuning the Immune Cell Response through Surface Nanotopography Engineering. Small Science. 10.1002/smsc.202400227.
PI(4,5)P2 assists the organization of FCHo2 on curved membranes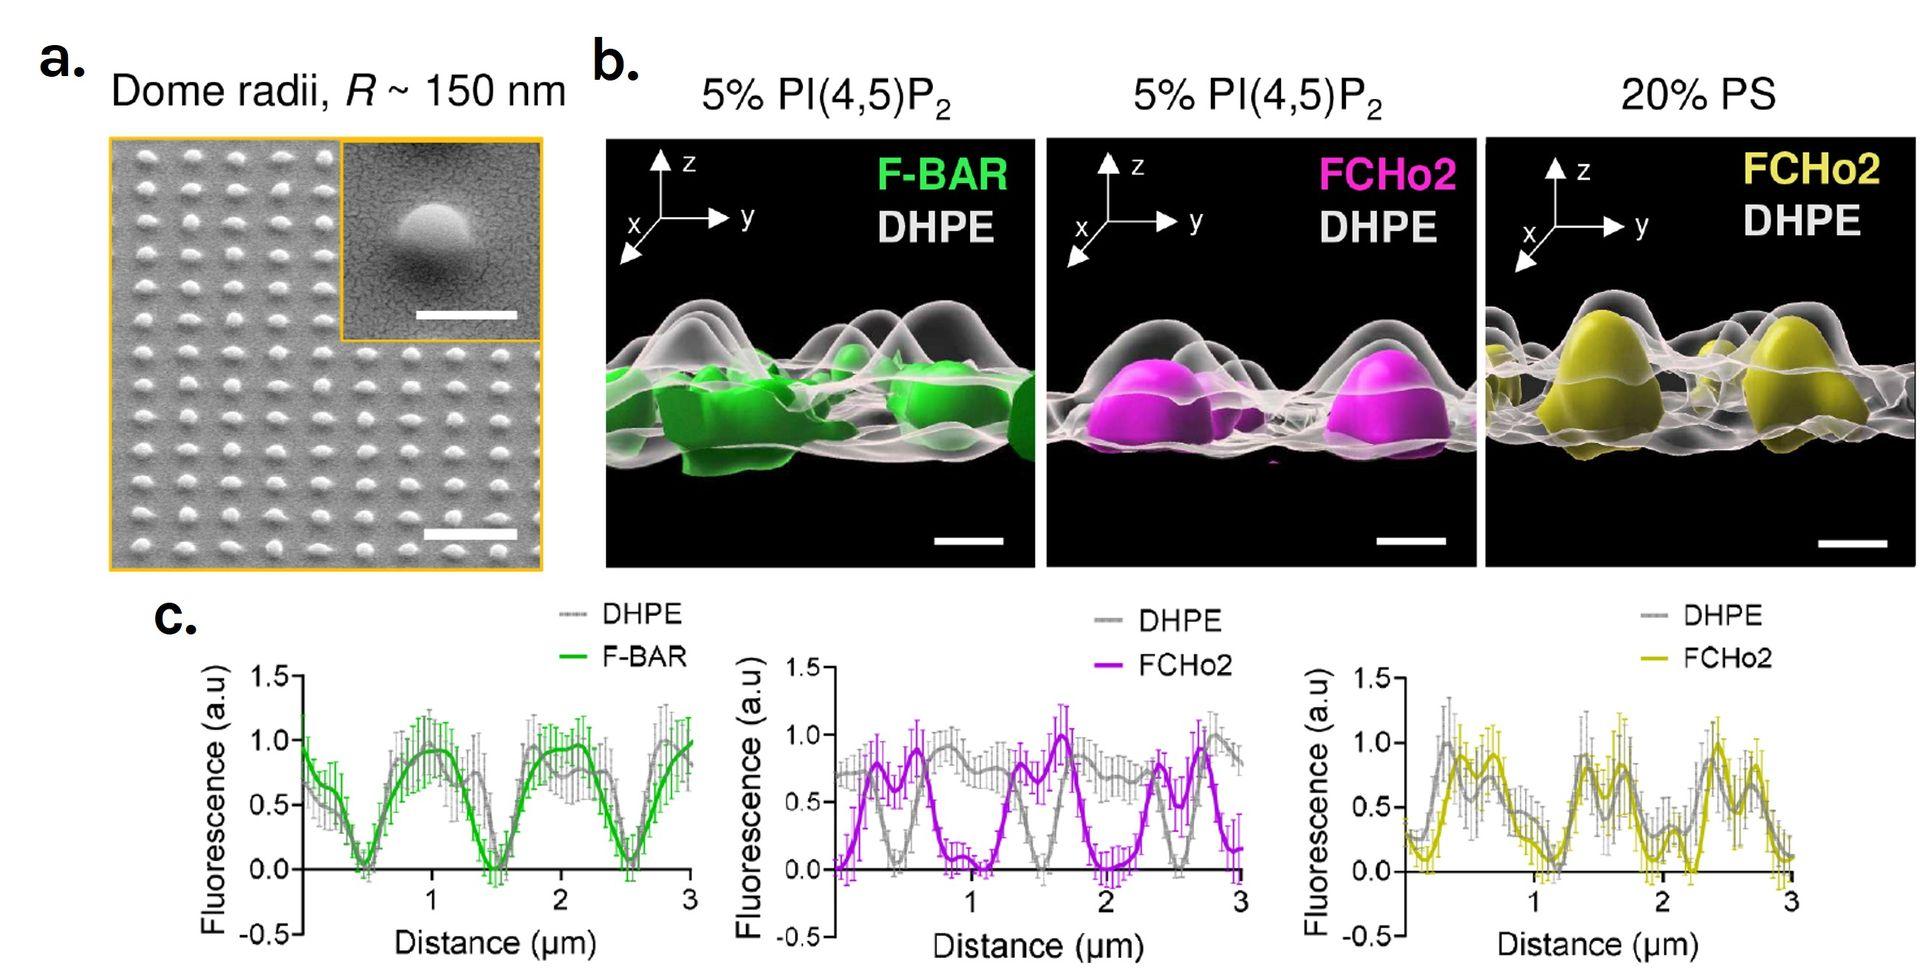
Source publication: El Alaoui F. et al, (2022). Structure and dynamics of FCHo2 docking on membranes. eLife. 10.7554/eLife.73156